Ok, before everyone pings me, I know it is now called VMware Aria Operations but the name change is so new that I know most people will still refer to it as vRops. Heck, I still call it Alive. Skittles view anyone? Anywho….are you looking for a way to monitor the bandwidth from your on-prem environment to VMware cloud on AWS? Well you are in the right place. In this guide I will show you how to use IPERF and Application Monitoring to build a dashboard in vROPS that you can watch and even alert on the available bandwidth. Before we jump into the technical details of the solution let me illustrate the challenge today and the solution we will be implementing.
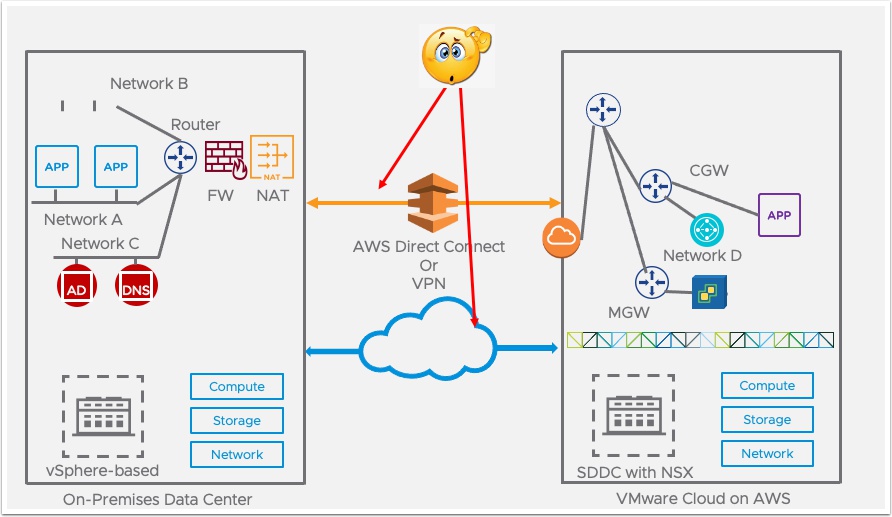
Challenge #1 How do I monitor bandwidth to and from VMC on AWS?
Challenge #2 Once I enable HCX how do I monitor those connections too?
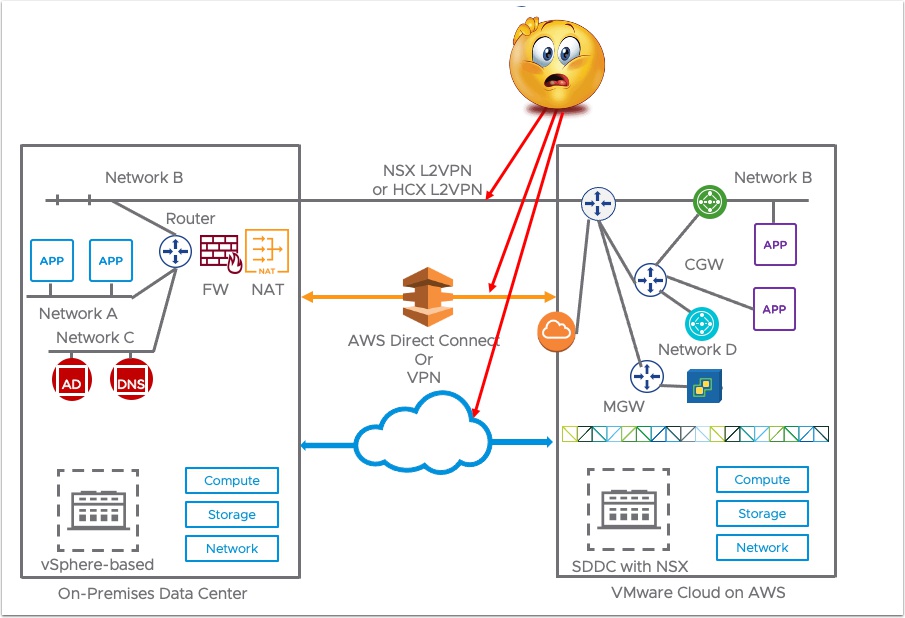
The Solution: Send traffic between two VM’s and measure the bandwidth with iPERF and send the results to vROPS and Publish as a dashboard!

Benefits:
- No special access needed, just deploy two VM’s or use existing VM’s
- See what your VM’s are really experiencing, not what a switch or router is telling you.
- YOu don’t need a CCSP or special skills, just deploy the scripts and done.
Let’s get started!
While this post is targeted at existing VMware Cloud on AWS customers with either a VPN or Direct Connect from On-prem, you really only need vSphere and vROPS configured to use this guide.
You will need two linux VM’s deployed, one in your on-prem environment and one in your VMC on AWS SDDC as shown above. In my lab I am using CentOS 7 VM’s but you can use any Linux OS as long as it is in the list of -> supported for vROPS Telegraph agent deployment. I will let you I am trying to get Photon OS working as it does say supported but in this example I will be using CentOS 7. In this example I am going to be testing bandwidth from On-prem to VMC using IPerf 3 . Once you see the mechanics of this you will be able to setup testing either way or new topologies with additional testing VM’s
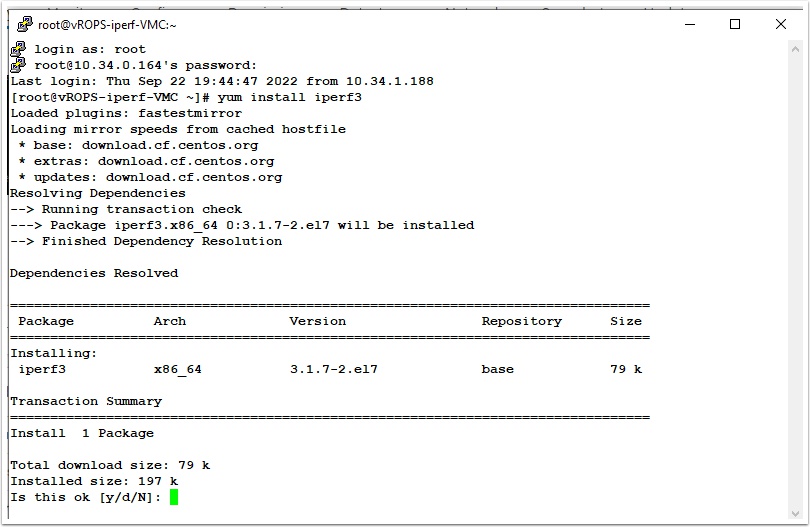
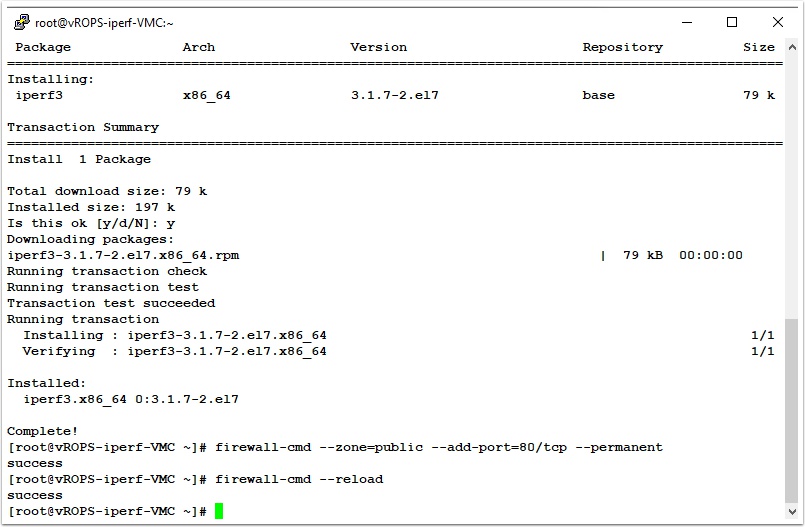
On both your on-prem and VMC VM’s install iperf 3 with the following command
yum install iperf3
On the VMC VM, Add a firewall rule to allow port 80 with the following commands
firewall-cmd --zone=public --add-port=80/tcp --permanent
firewall-cmd --reload
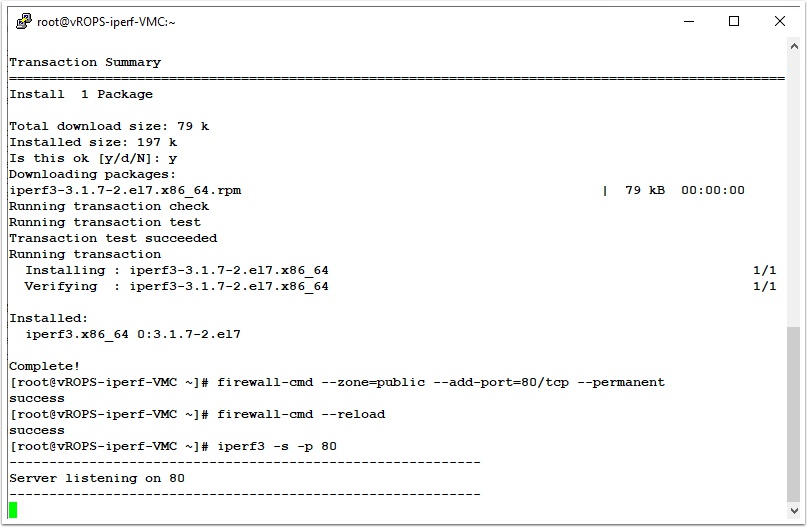
On the VMC VM start the iperf server to begin accepting connections with the following command
iperf3 -s -p 80
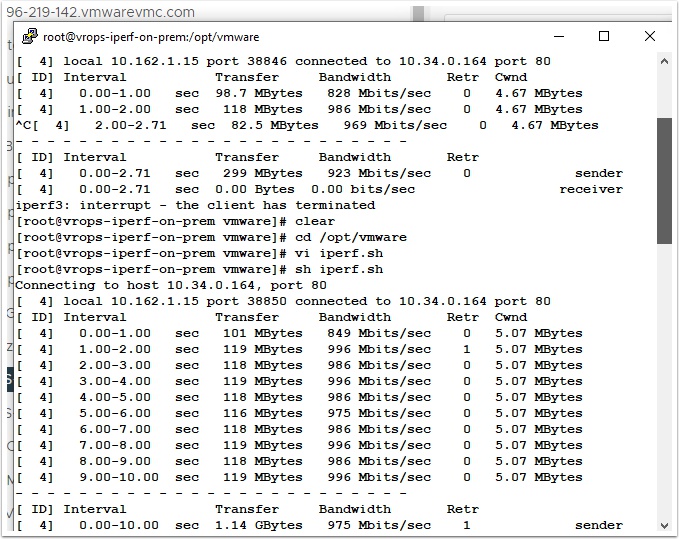
Switch over to the On-Prem VM and use vi editor to create the following script and save it
#!/bin/bash
while true
do
iperf3 -c 10.34.0.164 -p 80 -f m | tee /opt/vmware/iperf.log
sleep 30
done

NOTE: For testing purposes I have set the sleep timeout to 30 seconds. For production use you should consider how often you want to run this as it may impact your egress fees. For more settings see the sleep command options.
Run the script to test it works with the following command
sh iperf.sh
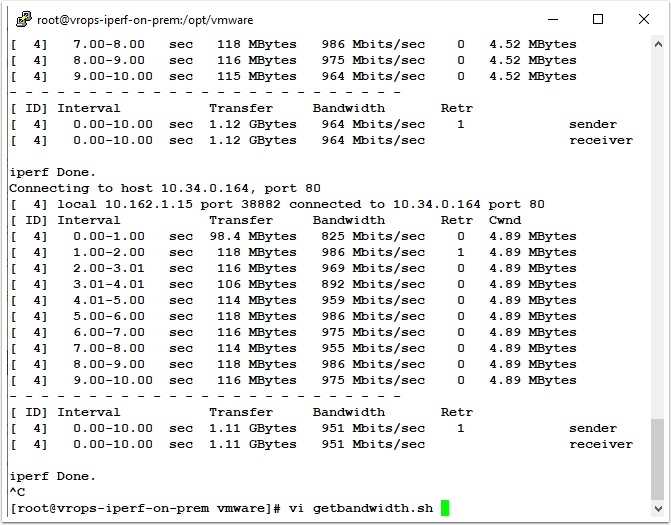
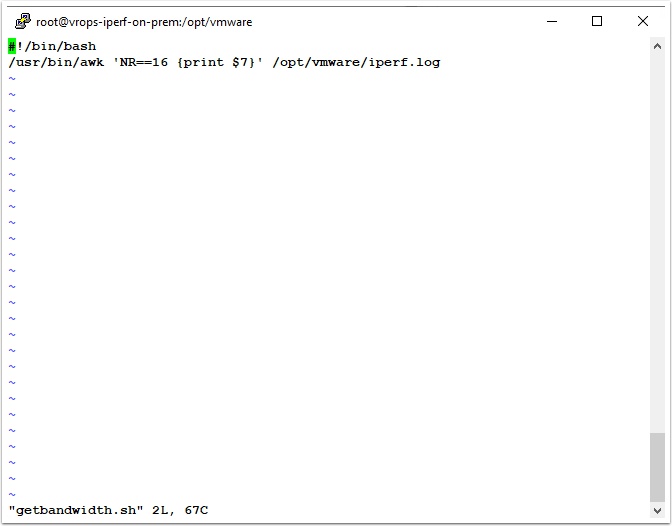
Press Control C to stop the script then use vi to create your getupdates.sh file
vi getupdates.sh
Copy and paste the following into your script and save it
#!/bin/bash
/usr/bin/awk 'NR==16 {print $7}' /opt/vmware/iperf.log
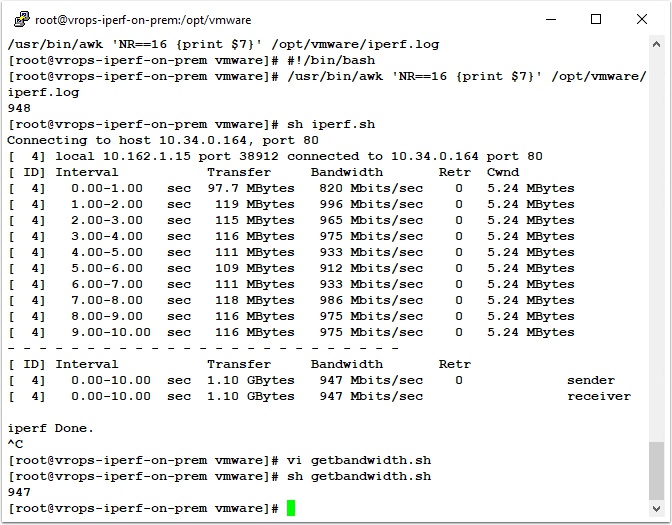
Verify it works with the following command
sh getupdates.sh
Notice the results of the script is a number and that number is the average Megabits per second to the VM in VMC. This is the number we will feed into vRops in the next step. For more information on script monitoring in vROPS watch the great video from John Diaz here
Now that everything is working, start your iperf script again so we can start collecting data with the following command
sh iperf.sh

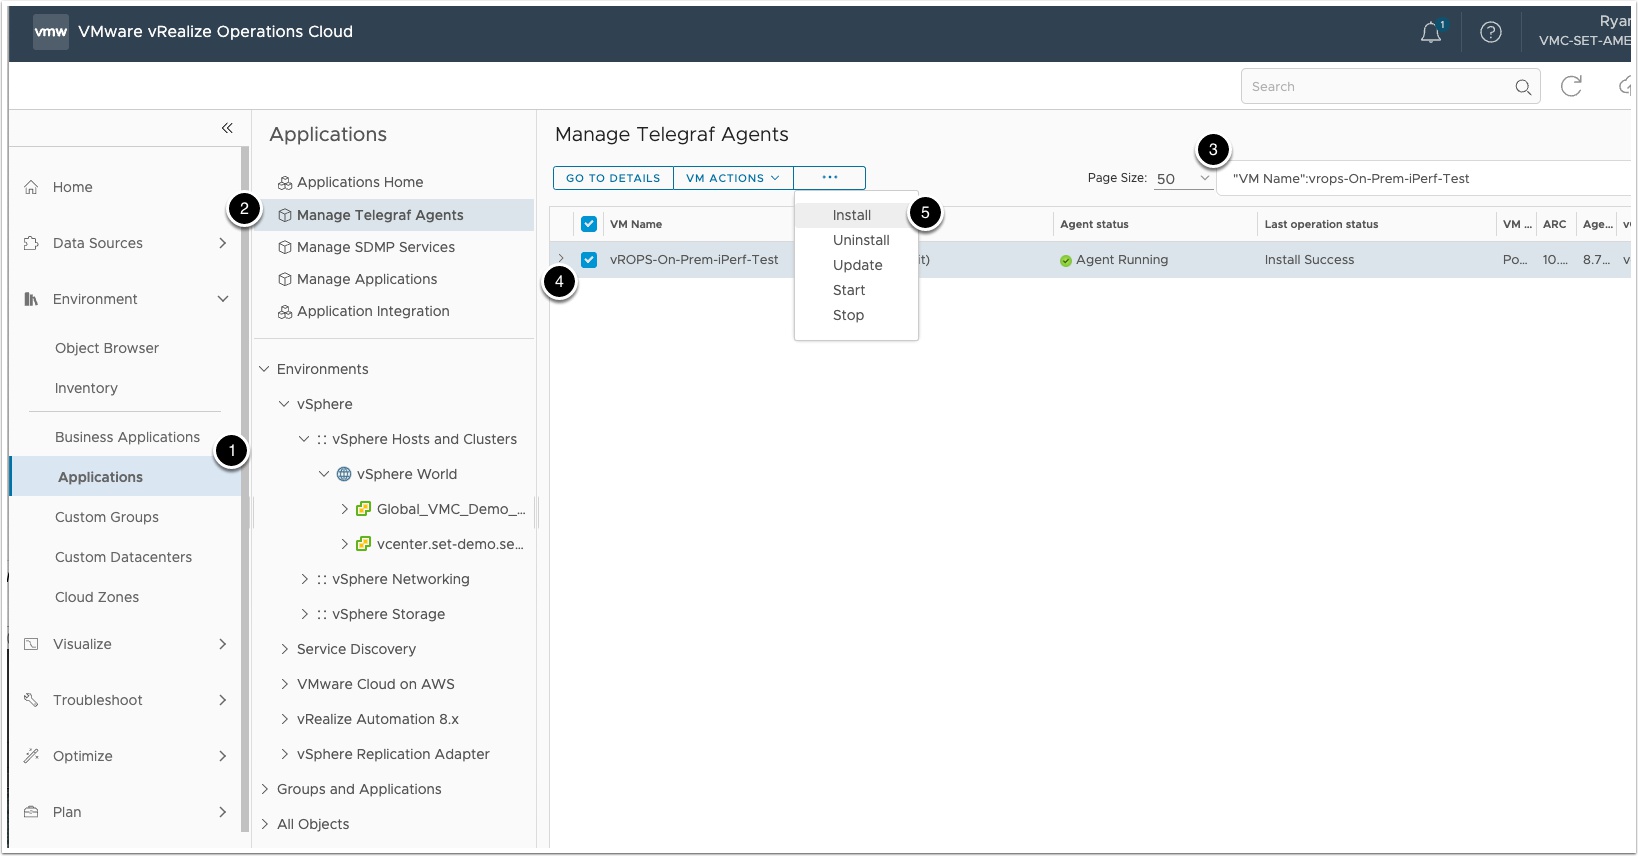
Login into vROPS and install the telegraf agent in the On-Prem VM via the following
- Under Environment Click Applications
- Select Manage Telegraf Agents
- Filter by the On-prem VM name
- Select your On-Prem-VM
- Click to Install
Select Common username & password and click next
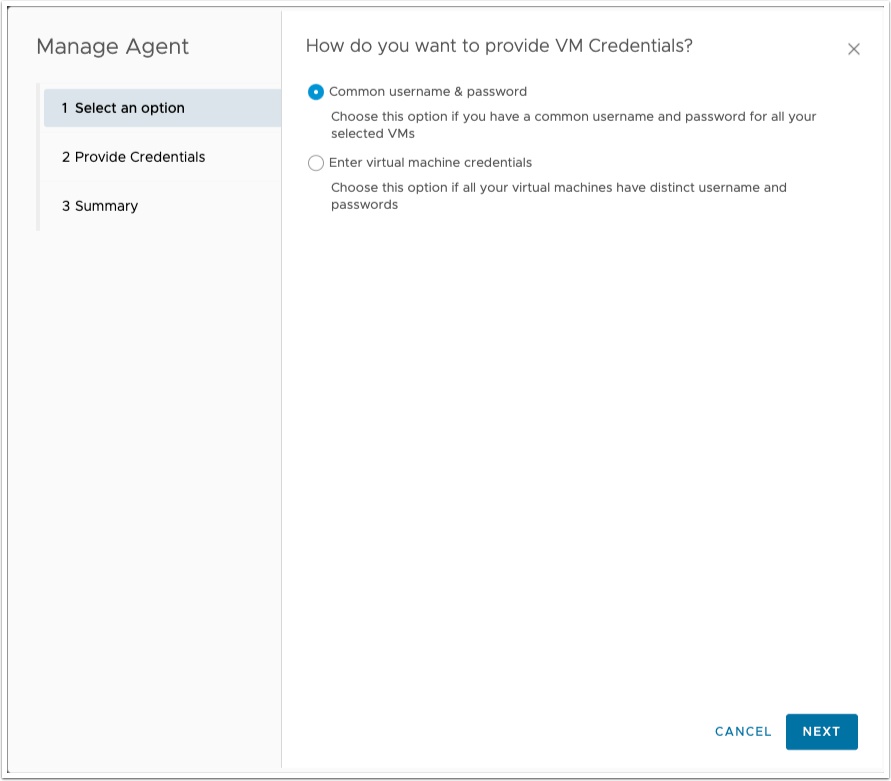
Enter the root user and password and click next
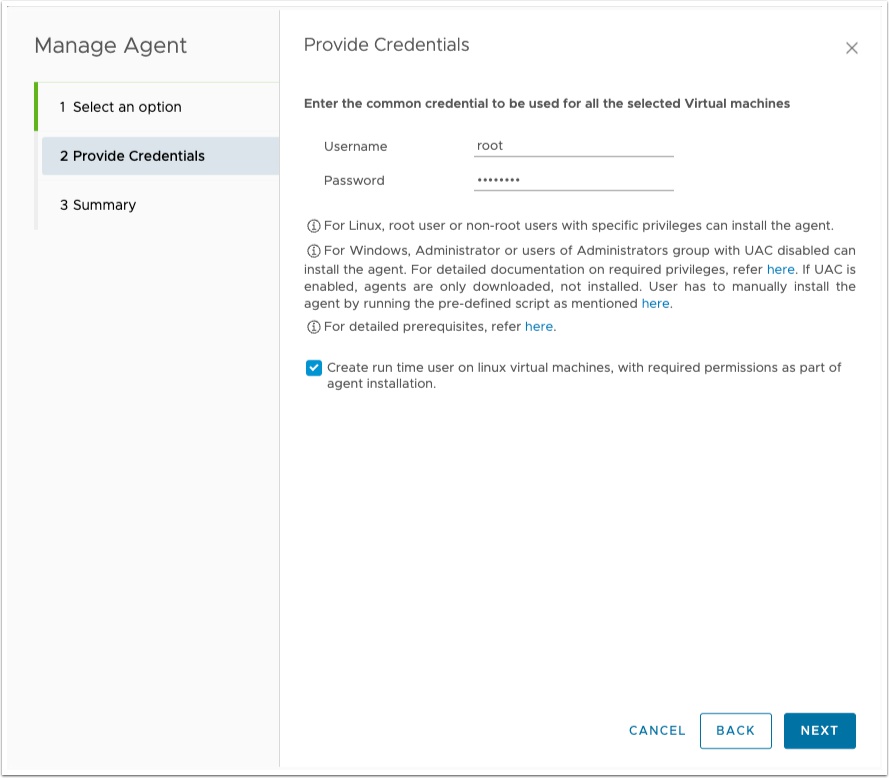
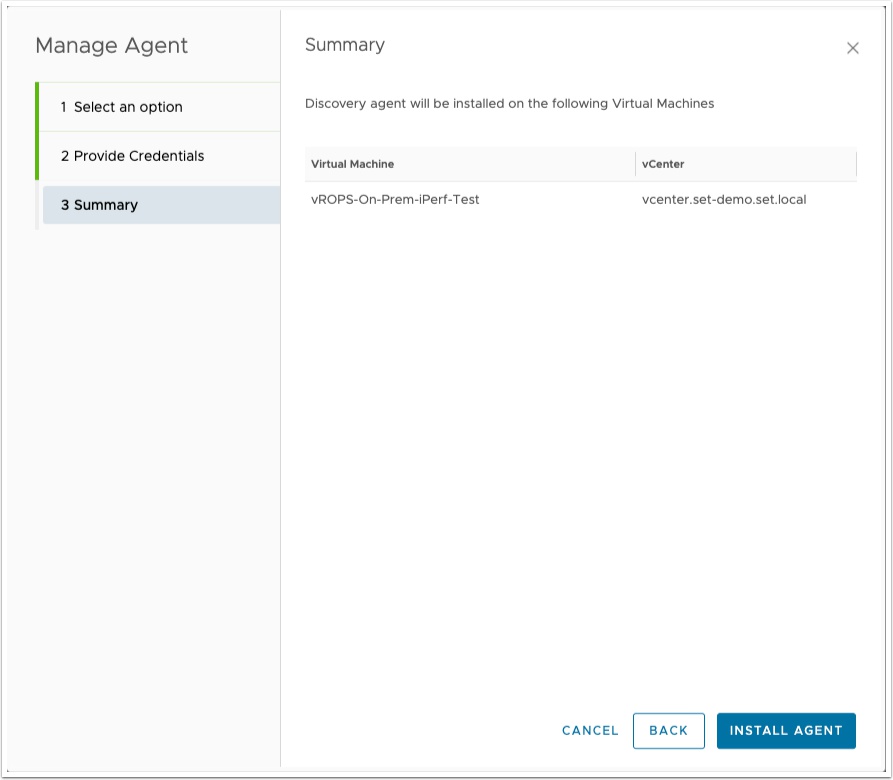
Click install agent
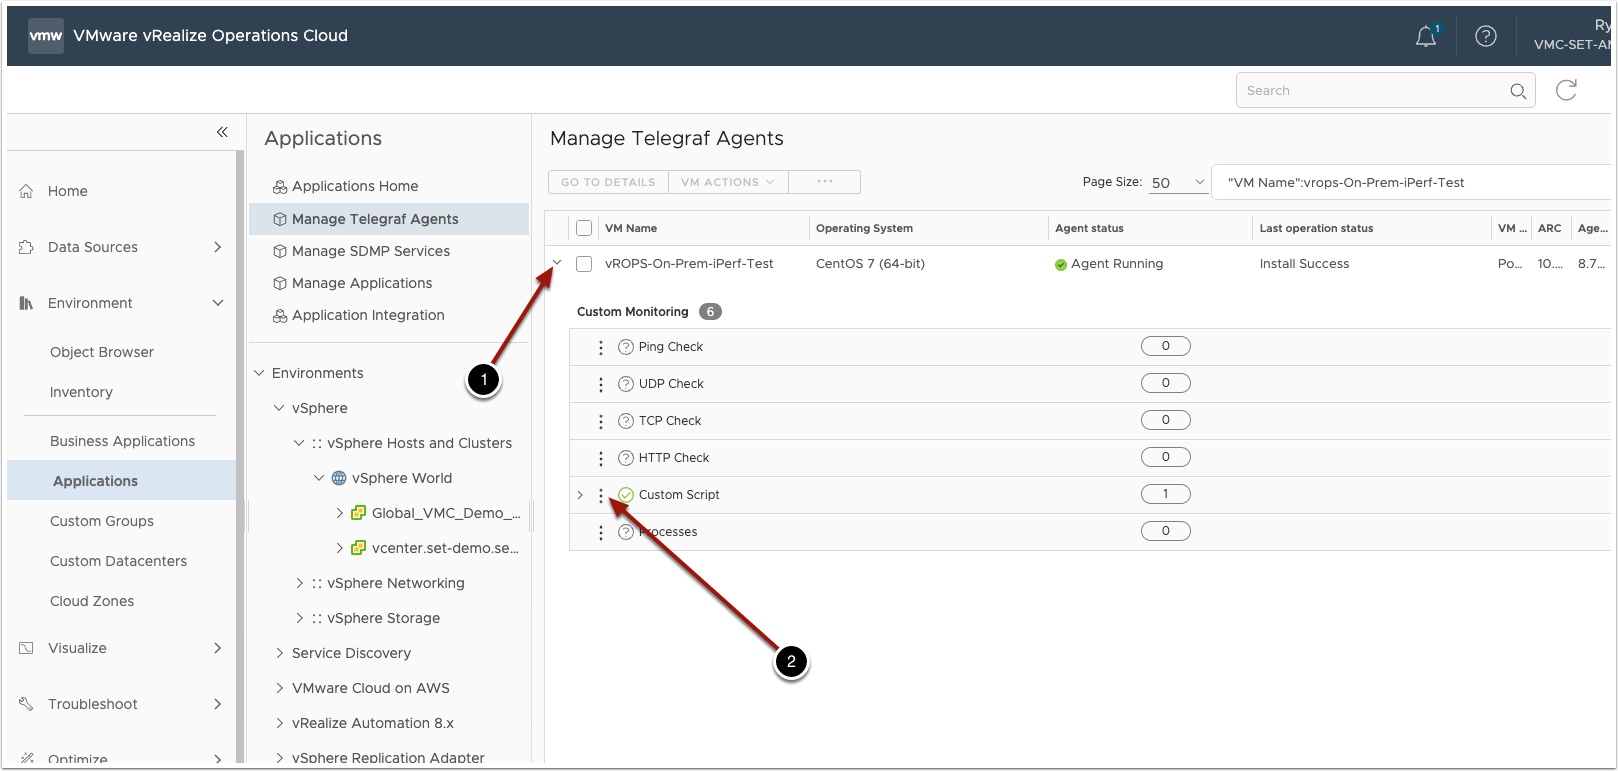
Once the agent install configure the custom script by doing the following
- Click the dropdown
- Click to install
Enter the following for the custom script config and click save
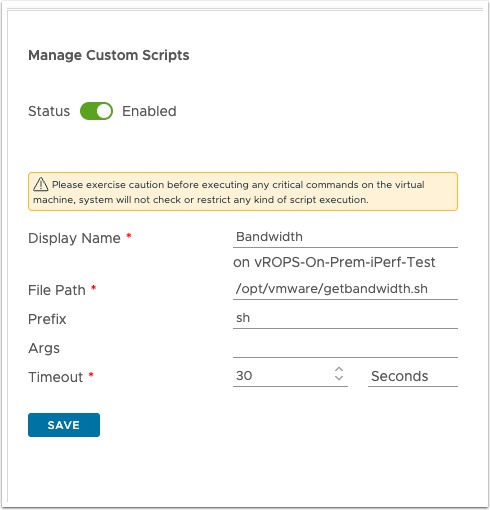
Note: I set the timeout to 30 seconds so you can test this and get some data quickly. If you are concerned with egress fees you can increase this to once a day.
Once the custom script activates without errors, go to details of the VM by clicking the following
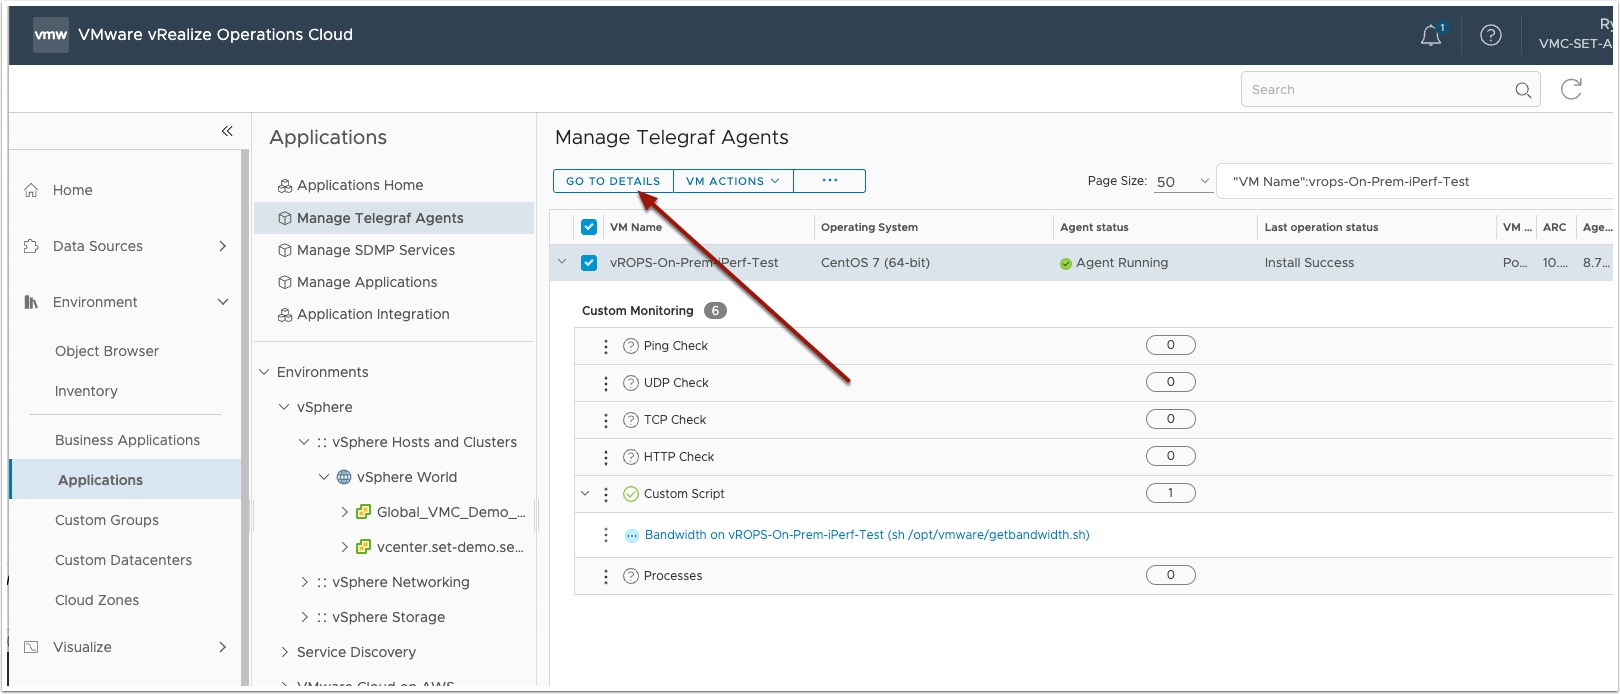 \
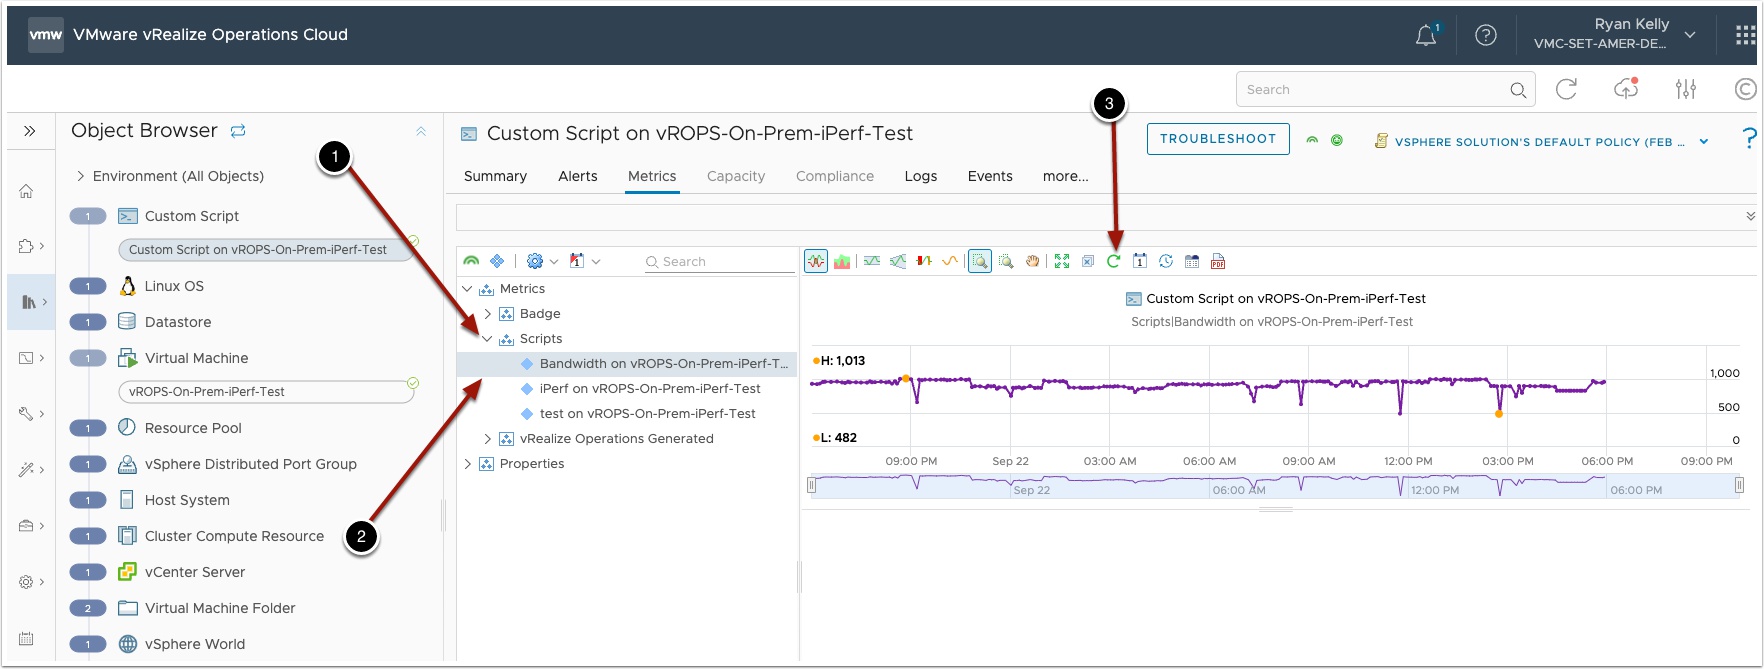
\View the custom script results via the following
- Under custom scripts click the Custom Script
- Click Metrics
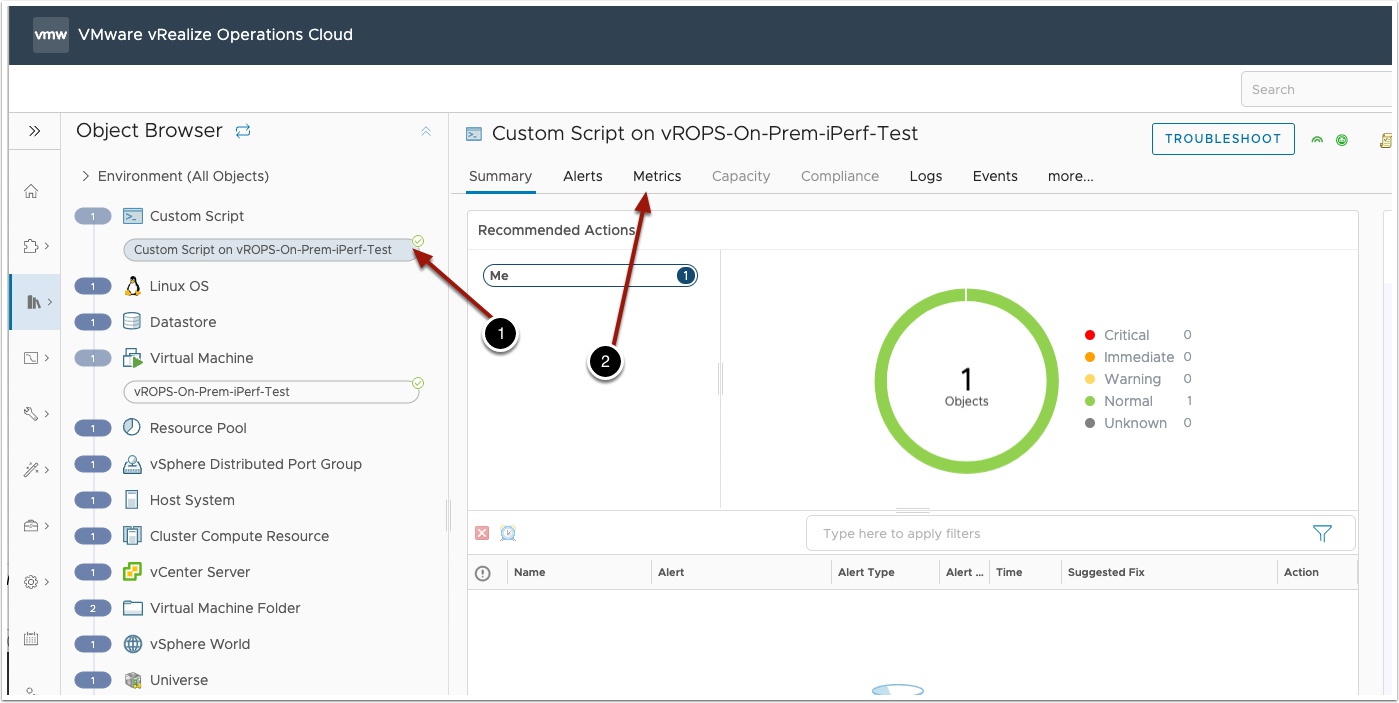
View the results via the following
- Click the scripts dropdown
- Select your custom script
- Click refresh to update the chart, note it may take several minutes to get some data